Experiment 7 The Spectrum of the Hydrogen Atom 实验7 氢原子光谱
1 Purpose 1 目的
In this experiment, you will observe the discrete light spectrum from a gas discharge lamp. You will find that the spectrum consists of a collection of sharp monochromatic lines. Using a diffraction grating spectrometer, you will be able to measure the wavelength of the emitted light to better than one part in a thousand. Therefore, it is crucial to make all calculations to five significant figures.
在本实验中,你将观察气体放电灯的离散光谱。你会发现该光谱由一系列清晰的单色谱线组成。使用衍射光栅光谱仪,你将能够测量发射光的波长,精确度优于千分之一。因此,进行所有计算时保持五位有效数字是至关重要的。
2 Introduction 2 引言
2.1 Spectrum of the Hydrogen Atom 2.1 氢原子光谱
When gases are subjected to large applied voltages, they tend to undergo dielectric breakdown and emit bright light. If one examines the light from such a gas discharge with a spectrometer , one finds that the light consists mainly of a few bright lines of pure color on a generally dark background. For example, excited hydrogen gas will emit four visible lines during breakdown: red, green, blue, and violet. This phenomenon contrasts sharply with the continuous spectrum of colors observed in light from the sun or an incandescent bulb.
当气体受到高电压时,它们会发生介电击穿并发出明亮的光。如果用光谱仪观察这种气体放电产生的光,我们会发现光主要由几条纯色的明亮谱线构成,这些谱线分布在较暗的背景上。例如,激发态的氢气在击穿时会发出四条可见谱线:红色、绿色、蓝色和紫色。这种现象与从太阳或白炽灯泡观察到的连续光谱形成鲜明对比。
The property of light that we observe as color is actually related to its wavelength . In the late nineteenth century, J.J. Balmer discovered an equation that correctly predicts the wavelengths of the visible lines in the hydrogen spectrum:
我们观察到的光的颜色特性实际上与其波长有关。在十九世纪末,J.J.巴耳末发现了一个方程,该方程可以正确预测氢光谱中可见谱线的波长:
[以下公式部分保持原样]
In this expression, , and is the so-called Rydberg constant,
在这个表达式中,,而是所谓的里德伯常数,
[^0]Other spectral lines beyond the visible wavelengths can be observed in hydrogen and other gases; in hydrogen, these wavelengths are given by the general formula:
[^0]在氢和其他气体中可以观察到可见波长之外的其他光谱线;对于氢,这些波长由以下通用公式给出:
where and are integers.
其中和是整数。
Balmer derived his formula for the hydrogen spectrum empirically; at the time, his result did not have a fundamental explanation grounded in classical physics. In fact, classical electromagnetism predicts that hydrogen atoms should radiate continuously, and, even worse, that they should be highly unstable . Neither prediction is observed, suggesting deep flaws in the classical description.
巴耳末通过实验推导出了他的氢光谱公式;在当时,他的结果在经典物理学中并没有基本的解释。事实上,经典电磁学预测氢原子应该连续辐射,而且更糟糕的是,它们应该是高度不稳定的。这两种预测都未被观察到,表明经典描述存在深层缺陷。
The origin of the line spectrum became a major problem that was not resolved until 1913, when Niels Bohr suggested an alternative theory for atoms. He proposed that the valence electron could only exist in certain energy states, and could only "jump" between these discrete states discontinuously. When a "jump" occurred, the atom would emit light to conserve energy. Since the energies were discrete, the emitted light should always have the same fixed set of colors (wavelengths).
谱线的起源成为一个重大问题,直到1913年尼尔斯·玻尔提出了一个关于原子的替代理论才得到解决。他提出价电子只能存在于某些能量态中,并且只能在这些离散态之间不连续地"跳跃"。当发生"跳跃"时,原子会发出光以守恒能量。由于能量是离散的,发射的光应该总是具有相同的固定颜色(波长)组合。
Bohr was able to derive a formula for the energy of the hydrogen atom's quantum energy levels in terms of the mass and charge of the electron, the permittivity of free space , Planck's constant , and an integer :
玻尔能够推导出一个公式来表示氢原子量子能级的能量,这个公式包含电子的质量和电荷、真空介电常数、普朗克常数以及整数:
Therefore the energy emitted by the atom during transition from an initial level to a final level is
因此,当原子从初始能级 跃迁到末态能级 时释放的能量为
The relationship between the energy and the wavelength of the light is due to Planck: . Hence, one can derive an expression for the wavelength of light emitted during an atomic transition:
光的能量 与波长 之间的关系源于普朗克公式: 。因此,我们可以推导出原子跃迁过程中发射的光的波长表达式:
2.2 Resolving a Spectrum with a Diffraction Grating 2.2 用衍射光栅分解光谱
In order to decompose a spectrum, one can use a so-called transmission grating. The grating is nothing more than a slab of material with a large number of tiny parallel slits. Transmission gratings are often made of finely machined glass or even crystals. The spacing between the slits is called the "lattice constant" of the grating.
为了分解光谱,我们可以使用所谓的透射光栅。光栅只不过是一块带有大量平行狭缝的材料。透射光栅通常由精密加工的玻璃或晶体制成。狭缝之间的间距 被称为光栅的"晶格常数"。
Consider a collimated (parallel) light beam incident on a grating from the left, as shown in Fig. 7.1. Each slit will diffract the beam, and act in turn as a new source of waves. The waves all begin in phase
考虑从左侧入射到光栅上的准直(平行)光束,如图7.1所示。每个狭缝都会使光束发生衍射,并依次作为新的波源。这些波最初都是同相的
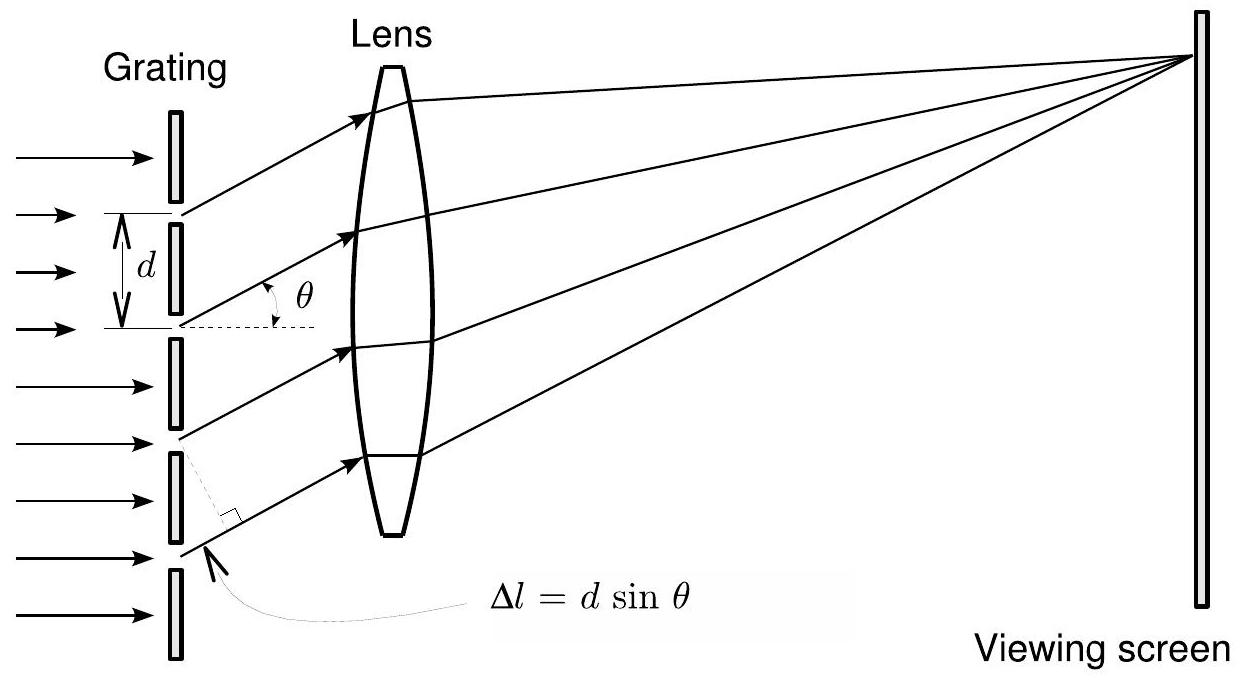
Figure 7.1: A diffraction grating with slit separation . The location of the diffraction maximum on the viewing screen is dependent on the wavelength of the incident light. Note that the horizontal scale in this diagram has been highly distorted.
图7.1: 具有狭缝间距 的衍射光栅。观察屏上衍射极大的位置取决于入射光的波长 。注意,该图中的水平比例已被高度失真。
at the slits, but depending on the angle with which they leave the grating (called the diffraction angle ), they travel different paths to the viewing screen and may be out of phase by that point. From the figure, the difference in the path length for two adjacent slits is
在狭缝处,但根据它们离开光栅时的角度(称为衍射角 ),它们到达观察屏的路径不同,在该点可能会产生相位差。从图中可以看出,相邻两个狭缝的光程差为
In order for the grating to form a maximum at some point on the viewing screen, the waves must be in phase there. This will occur if the path length difference is an integral multiple of the wavelength:
为了使光栅在观察屏上的某点形成极大值,该处的波必须同相。当光程差为波长的整数倍时,这种情况就会发生:
Therefore, we find that maxima will occur whenever
因此,我们发现极大值出现的条件是
where is called the order of the maxima. Equation (7.2) tells us that the maxima for a given will occur at different angles with respect to the laser beam direction. This is how the transmission grating decomposes a spectrum into its individual wavelengths. When light shines through the grating, particular colors will appear at several lower and higher angles relative to the forward direction . The order number refers to the relative position of a maximum with respect to .
其中 被称为极大值的级次。方程(7.2)告诉我们,对于给定的 ,极大值会相对于激光束方向出现在不同的角度上。这就是透射光栅将光谱分解为各个波长的原理。当光通过光栅时,特定的颜色会相对于前向方向 出现在若干个较小和较大的角度上。级次数 表示极大值相对于 的相对位置。
3 Experiment 3 实验
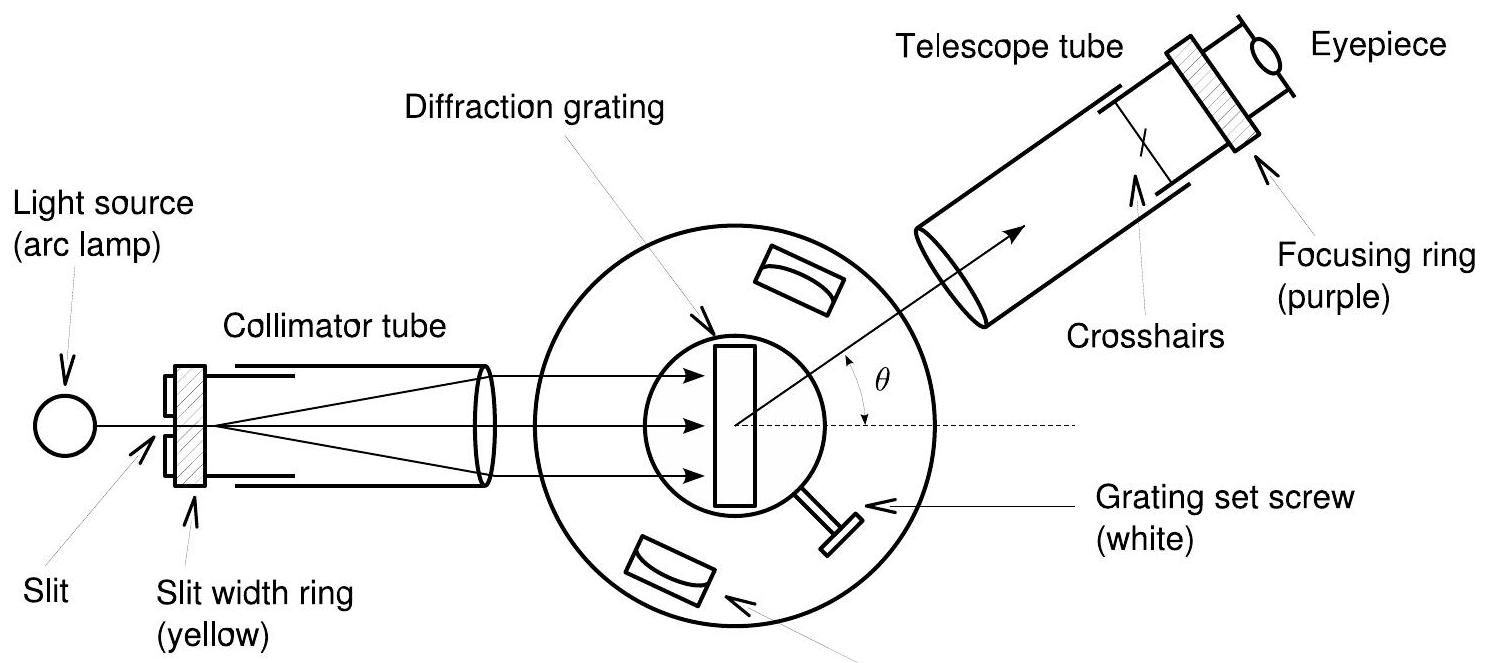
The equipment used in this experiment, called a diffraction grating spectrometer, is depicted in Fig. 7.2. The spectrometer contains three major components: a collimator tube, a rotating table, and a telescope.
本实验使用的设备称为衍射光栅光谱仪,如图7.2所示。光谱仪包含三个主要部件:准直管、旋转平台和望远镜。
Vernier scale 游标尺
Figure 7.2: Schematic of the spectrometer you will use to observe the hydrogen spectrum.
图7.2: 用于观察氢光谱的光谱仪示意图。
The collimator tube takes light from excited hydrogen gas, provided here by an arc lamp, and uses a lens to collimate the beam - that is, make the light rays from the source parallel. When the parallel rays exit the tube, they travel to the transmission grating, which is mounted in the center of the rotating spectrometer base. The light diffracted by the grating may be viewed through an eyepiece at the end of the telescope tube.
准直管接收由弧光灯提供的激发氢气发出的光,并使用透镜准直光束 - 即使来自光源的光线平行。当平行光线离开管后,它们传播到安装在旋转光谱仪底座中心的透射光栅。经光栅衍射的光可以通过望远镜筒末端的目镜观察。 The telescope is able to swivel with respect to the grating, allowing you to sweep through a set of angles and observe the angle dependence of the various spectral lines. Using eq. (7.2), you can then use this angle to determine the wavelength of each line you observe. To determine the angles, the spectrometer base contains a graduated circle attached to the telescope. As you turn the telescope, you can read off the angle using the angular scale scored into the circle.
望远镜能够相对于光栅转动,使你能够扫过一系列角度 并观察各种光谱线的角度依赖关系。使用公式(7.2),你可以利用这个角度来确定你观察到的每条谱线的波长。为了测定角度,光谱仪底座上装有一个刻度圆盘,与望远镜相连。当你转动望远镜时,你可以通过刻在圆盘上的角度刻度读取角度 。
3.1 How to Read the Angular Scale 3.1 如何读取角度刻度
The angular scale in the base is not a standard ruler, but a Vernier ruler. With a standard angular scale, you would probably be able to resolve angles down to the nearest degree or half degree. In this experiment, we would like considerably more precision in our measurements. Therefore, the spectrometer contains a scale that allows users to measure angles with great accuracy, to the nearest arcminute .
底座上的角度刻度不是标准尺,而是游标尺。使用标准角度刻度,你可能只能将角度精确到最接近的度或半度。在这个实验中,我们需要在测量中获得更高的精度。因此,光谱仪配备了一个刻度,使用者可以非常精确地测量角度,精确到最接近的弧分 。
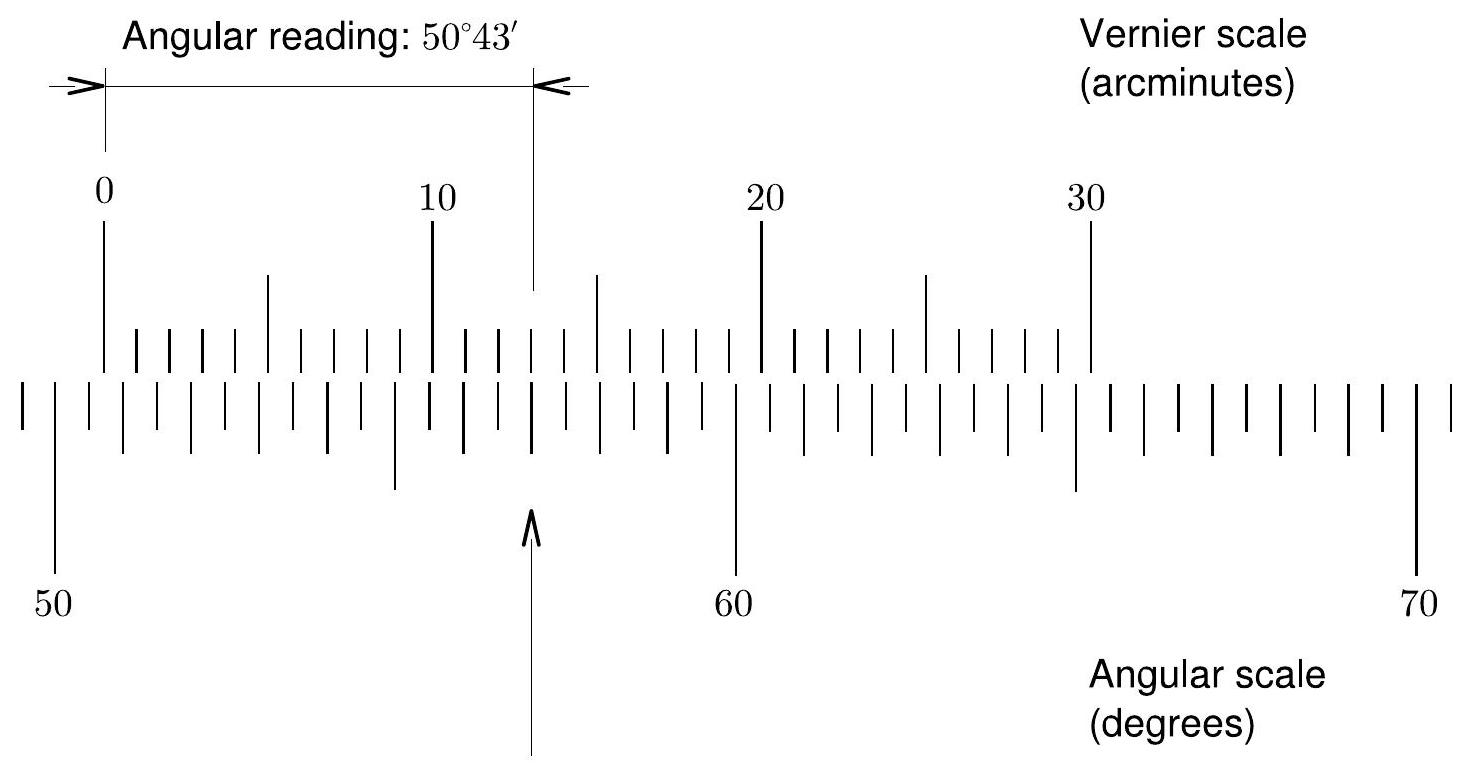
Figure 7.3: Sample reading from the degree and Vernier scales in the spectrometer base.
图7.3: 光谱仪底座上的度数和游标刻度读数示例。
The device can achieve this precision by having two scales rather than one. The first is a standard degree scale running from to , and the second is a Vernier scale running from to ( to ). To understand how these two scales work together, consult Fig. 7.3 as you read the following procedure.
这个装置通过使用两个刻度而不是一个来实现这种精度。第一个是从 到 的标准度数刻度,第二个是从 到 ( 到 )的游标刻度。要理解这两个刻度如何协同工作,请在阅读以下步骤时参考图7.3。
-
Begin by finding the zero marker on the Vernier scale.
-
Scan down from the Vernier scale to the next line on the degree scale, as read from the left. This line is the angle , accurate to the nearest half degree ( ).
-
Reading from left to right, find the line on the Vernier scale that best lines up with a line on the degree scale. This value marks, in arcminutes, your position between two ticks on the degree scale.
-
Add the first reading from the degree scale to the second reading from the Vernier scale. You have now measured to the nearest arcminute.
-
首先找到游标刻度上的零标记。
-
从游标刻度向下扫视到度数刻度上的下一条线,从左侧读数。这条线就是角度 ,精确到最接近的半度 ( )。
-
从左向右读数,找到游标刻度上最佳对齐度数刻度上一条线的那条线。这个值以弧分为单位标记了你在度数刻度两个刻度之间的位置。
-
将度数刻度的第一个读数加上游标刻度的第二个读数。这样你就测得了精确到弧分的 值。
Again, refer to Fig. 7.3 as you read this procedure. In the figure, the 0 mark on the Vernier scale is between and . Hence, the base measurement is , since we are reading from the left. On the Vernier scale, the mark 13 best matches a mark on the degree scale. Therefore, within the half degree interval, we add an additional . The resulting measurement is
再次参考图7.3阅读这个步骤。在图中,游标刻度上的0标记位于 和 之间。因此,由于我们从左侧读数,基准测量值是 。在游标刻度上,标记13最好地对应度数刻度上的一个标记。因此,在这半度区间内,我们加上额外的 。最终的测量结果是
3.2 Measurement Error 3.2 测量误差
For the spectrometer, you will be using the Vernier scale to measure the angular separation of the various slit images (or the angular separation of the various colored lines).
对于光谱仪,你将使用游标刻度来测量各个狭缝图像的角度间隔(或各种彩色谱线的角度间隔)。
A simplistic view might be to take the error of each measurement to be the maximum resolution of the Vernier ruler, but what would be a better approach for this? Hint: It has to do with the finite width of the lines you are measuring.
一个简单的观点可能是将每个测量的误差取为游标尺的最大分辨率,但有什么更好的方法吗?提示:这与你所测量的谱线的有限宽度有关。
4 Procedure 4 实验步骤
The first part of the experiment will basically include the procedure to set up the equipment. This should be done with as much care as possible. Only then will you be able to measure the wavelength on the limit of our apparatus. If you don't set up the spectrometer correctly you will get systematic errors, skewing your results.
实验的第一部分基本上包括设置设备的步骤。这应该尽可能小心地完成。只有这样,你才能在我们仪器的极限范围内测量波长。如果你没有正确设置光谱仪,你将得到系统误差,使你的结果产生偏差。
4.1 Adjusting the Spectrometer 4.1 调节光谱仪
-
Take the grating out of the holder and close the green knob.
-
Rotate the yellow knob such that the slit is about half open.
-
In the straight-through position , look through the eyepiece and turn the purple focusing ring until you see a sharp image of the slit.
-
Loosen the red knob and move the telescope tube until the crosshairs are in the middle of the slit. Tighten red knob.
-
Open the green knob and turn the tabletop such that the zero mark from the Vernier scale with the magnifying glass is lined with either or from the outer scale. Always use only this Vernier scale and don't switch to the other one in between. Close the green knob and don't open it again for the rest of the experiment!
-
Now you can fine adjust the relative position of the inner and outer scale by turning the blue knob. Line up the zero on the Vernier scale and and on the degree scale as carefully as possible. NOTE: For some of the spectrometers, there is a small mark to the left of the zero mark on the Vernier scale. Make sure that you line up the zero mark, and not the extra mark, with .
-
Put the grating in the holder such that it is perpendicular to the telescope tube-collimator tube line. Close the white screw to lock the grating.
-
从支架中取出光栅并关闭绿色旋钮。
-
旋转黄色旋钮使狭缝开启约一半。
-
在直通位置 ,通过目镜观察并转动紫色调焦环,直到看到清晰的狭缝的图像。
-
松开红色旋钮并移动望远镜筒,直到十字线位于狭缝的中心。拧紧红色旋钮。
-
打开绿色旋钮并转动转台,使带放大镜的游标尺的零刻度与外部刻度的 或 对齐。始终只使用这个游标尺,不要在过程中切换到其他游标尺。关闭绿色旋钮,在实验剩余时间内不要再打开!
-
现在你可以通过转动蓝色旋钮来微调内外刻度的相对位置。将游标尺的零点与 和度数刻度尽可能精确地对齐。注意:对于某些光谱仪,游标尺的零刻度左侧有一个小标记。确保将零刻度(而不是额外的标记)与 对齐。
-
将光栅放入支架中,使其垂直于望远镜筒-准直管连线。拧紧白色螺丝以锁定光栅。
4.2 Obtaining the Grating Lattice Constant 4.2 测定光栅晶格常数
After adjusting the spectrometer you will measure the yellow line of a helium discharge lamp. Since we know that the wavelength of this light is , we can determine the lattice constant of the grating quite accurately. Even though the grating has 600 lines written on it, this is only an approximation. We want to know the lattice constant to five significant digits and not just three, and so you have to measure it.
调节好光谱仪后,你将测量氦放电灯的黄色谱线。由于我们知道这种光的波长是 ,我们可以相当准确地确定光栅的晶格常数 。尽管光栅上标注有600线/,但这只是一个近似值。我们需要知道晶格常数的五位有效数字而不是仅仅三位,所以你必须进行测量。
-
Switch on the helium lamp and line the spectrometer up such that you can see the slit well illuminated by the lamp as you look through the telescope.
-
Put the black cardboard over the front end of your collimator tube and cover the spectrometer with a black piece of cloth to block light from your surroundings (but be careful not to block the telescope with the cloth).
-
NOTE: This step and the next should be performed in the dark; therefore, switch on the incandescent light and turn off the fluorescent light in the room.
-
Open the red knob and move the telescope tube to the left until the crosshairs are in the center of the yellow line. You should first see a few blue and green lines, then the isolated yellow line, and then red lines. The yellow line should be somewhere around degrees.
-
Note down the angle in degrees and minutes where you see the first order of the yellow line. Do the same on the right side and average these two numbers.
-
Use the average and plug it into the grating equation to determine the lattice constant to at least 5 significant figures.
-
How many lines does this lattice constant correspond to? Can you also see the second and third order yellow lines on either side of ?
-
打开氦灯并调整光谱仪,使得通过望远镜观察时可以看到被灯充分照亮的狭缝。
-
在准直管前端放置黑色纸板,并用一块黑色布遮盖光谱仪以阻挡周围环境的光(但要注意不要用布挡住望远镜)。
-
注意:这一步和下一步应在暗室中进行;因此,打开房间的白炽灯并关闭荧光灯。
-
打开红色旋钮并向左移动望远镜筒,直到十字线位于黄色谱线的中心。你应该首先看到几条蓝色和绿色谱线,然后是独立的黄色谱线,之后是红色谱线。黄色谱线应该在大约 度的位置。
-
记录下你看到黄色谱线一级衍射的角度(度和分)。在右侧重复相同的操作,并取这两个数的平均值。
-
将平均值代入光栅方程 以确定至少5位有效数字的晶格常数 。
-
这个晶格常数对应于多少条线/?你能在 两侧看到黄色谱线的二级和三级衍射吗?
4.3 Measuring the Spectrum of Hydrogen Atoms 4.3 测量氢原子的光谱
At this point, you are ready to use your calibrated equipment to observe the hydrogen spectrum. The procedure is similar to the steps you already followed during the calibration.
此时,你已经准备好使用校准过的设备来观察氢光谱。这个程序与你在校准过程中已经遵循的步骤类似。
A note about using the hydrogen lamp: The hydrogen bulb is very fragile and should only be used for a limited amount of time. We have a timer set up so that the lamp can only be on for 25 seconds at a time, with a 30 second wait period (period when the lamp is off). This is important so that the lamp doesn't burn out during your experiment. Please do not unplug or override the timer.
关于使用氢灯的注意事项:氢灯泡非常脆弱,只能在有限的时间内使用。我们设置了一个定时器,使灯每次只能亮25秒,然后有30秒的等待期(灯熄灭的时间)。这一点很重要,可以防止灯在你的实验过程中烧坏。请不要拔掉或绕过定时器。
-
Switch off the He lamp and set up the spectrometer for the hydrogen lamp.
-
The light purple line you see in the middle is the order line.
-
There are four visible lines in the spectrum: one red (furthest out), one greenish-blue, one purpleblue and one dark purple. The dark purple line is very faint and you may not be able to see it. Look on both sides of the straight-through position since the dark purple line may be clearer on one side than the other. Note: You may also see "background" lines between the red and greenish-blue lines - be careful!
-
Measure the angles of the four lines for at least two orders on both sides (the first and second order). Average the angles from both sides for each order.
-
How many orders do you see on either side? E.g., look for the red line and count how often it appears as you go further out.
-
Do the higher orders overlap? That is, does a new order start before the old one ends? What do you expect? Why?
-
关闭氦灯并为氢灯设置光谱仪。
-
你在中间看到的浅紫色谱线是级谱线。
-
光谱中有四条可见谱线:一条红色的(最外侧)、一条绿蓝色的、一条紫蓝色的和一条深紫色的。深紫色谱线非常微弱,你可能看不到。观察直通位置的两侧,因为深紫色谱线在某一侧可能会更清晰。注意:你可能会在红色和绿蓝色谱线之间看到"背景"谱线 - 要小心!
-
测量这四条谱线在两侧至少两个级次(第一和第二级次)的角度。对每个级次取两侧角度的平均值。
-
你在每侧看到多少个级次?例如,观察红色谱线并数一数它在往外延伸时出现了多少次。
-
更高级次是否重叠?也就是说,新的级次是否在旧的结束之前就开始了?你有什么预期?为什么?
4.4 Summary of data: 4.4 数据总结:
-
Grating lattice constant section:
-
and for yellow line of He
-
光栅晶格常数部分:
-
氦黄色谱线的和值
-
Hydrogen spectrum:
-
and for first and second order red, green, blue and purple lines.
-
氢光谱:
-
第一和第二级次红色、绿色、蓝色和紫色谱线的和值。
5 Analysis 5 分析
The analysis of the data should be fairly easy. There are not too many data points, but remember that you should propagate errors!
数据分析应该相当简单。数据点不是很多,但要记住你应该传递误差!
-
Put together formulas (7.1) and (7.2) and solve the resulting expression for .
-
将公式(7.1)和(7.2)组合起来,求解得到的表达式。
-
Use your data, the value for , and to determine for both orders independently.
-
使用你的数据、值和来独立确定两个级次的。
-
Remember that should be an integer number labeling the initial atomic shell occupied by the excited valence electron in each hydrogen atom.
-
记住应该是一个整数,表示每个氢原子中被激发的价电子所占据的初始原子壳层。
-
Are the results integers, or close to them?
-
结果是整数还是接近整数?
-
Are the integer numbers consistent with the predictions of the Balmer Formula and the Bohr Model?
-
这些整数是否与巴耳末公式和玻尔模型的预测一致?
-
Which order gives the best results?
-
哪个级次给出最好的结果?
-
For which color did the electrons jump from the lowest shell? Explain why you could have predicted that anyway.
-
哪种颜色的电子是从最低壳层跃迁的?解释为什么你能预测到这一点。
-
What energy difference do these shells correspond to? How does the get excited into these states?
-
这些壳层对应什么能量差?是如何被激发到这些状态的?
-
For which energy level did you have the most precise measurement? Can you explain why?
-
对于哪个能级,你的测量最精确?你能解释原因吗?
-
Why can you only see four lines in the Hydrogen spectrum?
-
为什么在氢光谱中你只能看到四条谱线?
-
What is the order line? Why does it appear?
-
什么是级谱线?为什么会出现?
-
To what precision (in percent) were you able to measure the data? Compare that to other experiments you have performed in this course. Discuss.
-
你能以多高的精度(百分比)测量数据?将其与你在本课程中进行的其他实验进行比较并讨论。
-
What is the precision of measurement on the spectrometer? What precision does this correspond to on the wavelength? How does this compare to measurements of the laser wavelength in the Polarization/Interference and Interferometer labs?
-
光谱仪的测量精度是多少?这对应于波长的什么精度?这与偏振/干涉和干涉仪实验中激光波长的测量相比如何?
-
Discuss the factors that determine the uncertainty in your measurements. Which of these are random, and which are systematic?
-
讨论决定你的测量不确定性的因素。哪些是随机的,哪些是系统的?
[^0]: A device that decomposes light into its constituent wavelengths.
[^0]: 一种将光分解成其组成波长的装置。
[^1]: The electrons should fall into the nuclei within a short timespan, collapsing the atom.
[^1]: 电子应该在很短的时间内落入原子核,导致原子坍缩。